
Monitor your webhooks
Track your webhook performance with detailed analytics. Learn how to view webhook usage statistics, understand event statuses, and troubleshoot webhook delivery issues using TheirStack's built-in monitoring dashboard.
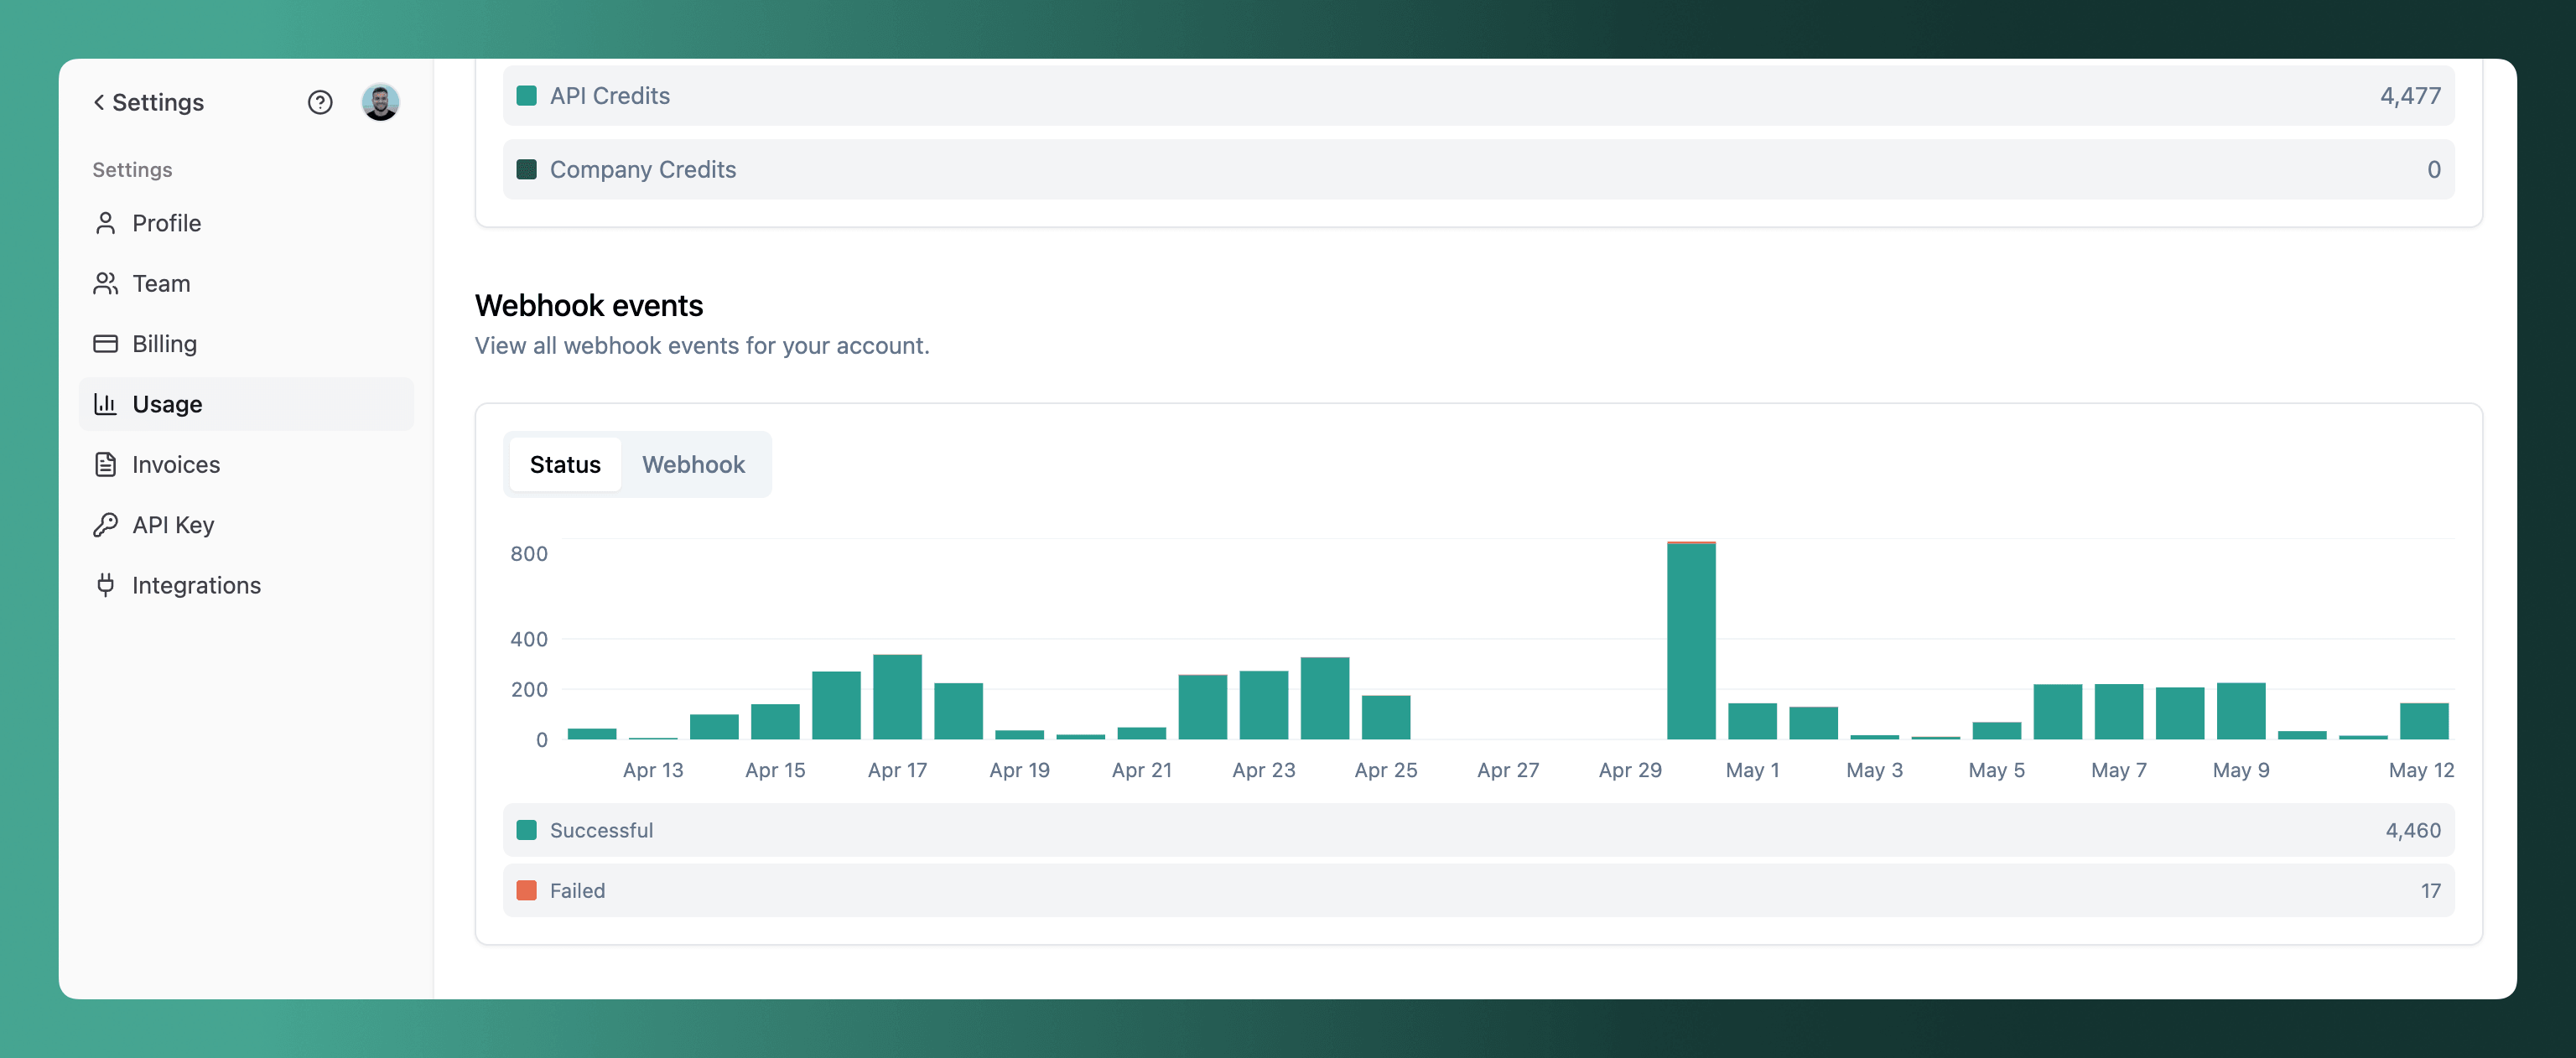
You can monitor all your webhooks usage in the Usage page. In the "Webhooks events" section you can see the total number of events triggered by your webhooks.
You can see the breakdown of the webhook events by event status or webhook.
- Event Status: success, in progress, failed, not_triggered. Learn more about the webhook events statuses.
- Webhook: name of the webhook that triggered the event.
Webhook events statuses
Webhook events have the following statuses:
success: The webhook event was processed successfully. The endpoint returned a 200 status code.in progress: The webhook event is being processed, it could take a few minutes to be processed.failed: The webhook event failed to be processed. The endpoint returned a non-200 status code. Don't worry, it will be retried every hour for 48 hours.not_triggered: The webhook event was detected but not triggered because you run out of API credits.
How to manually resend a failed webhook event?
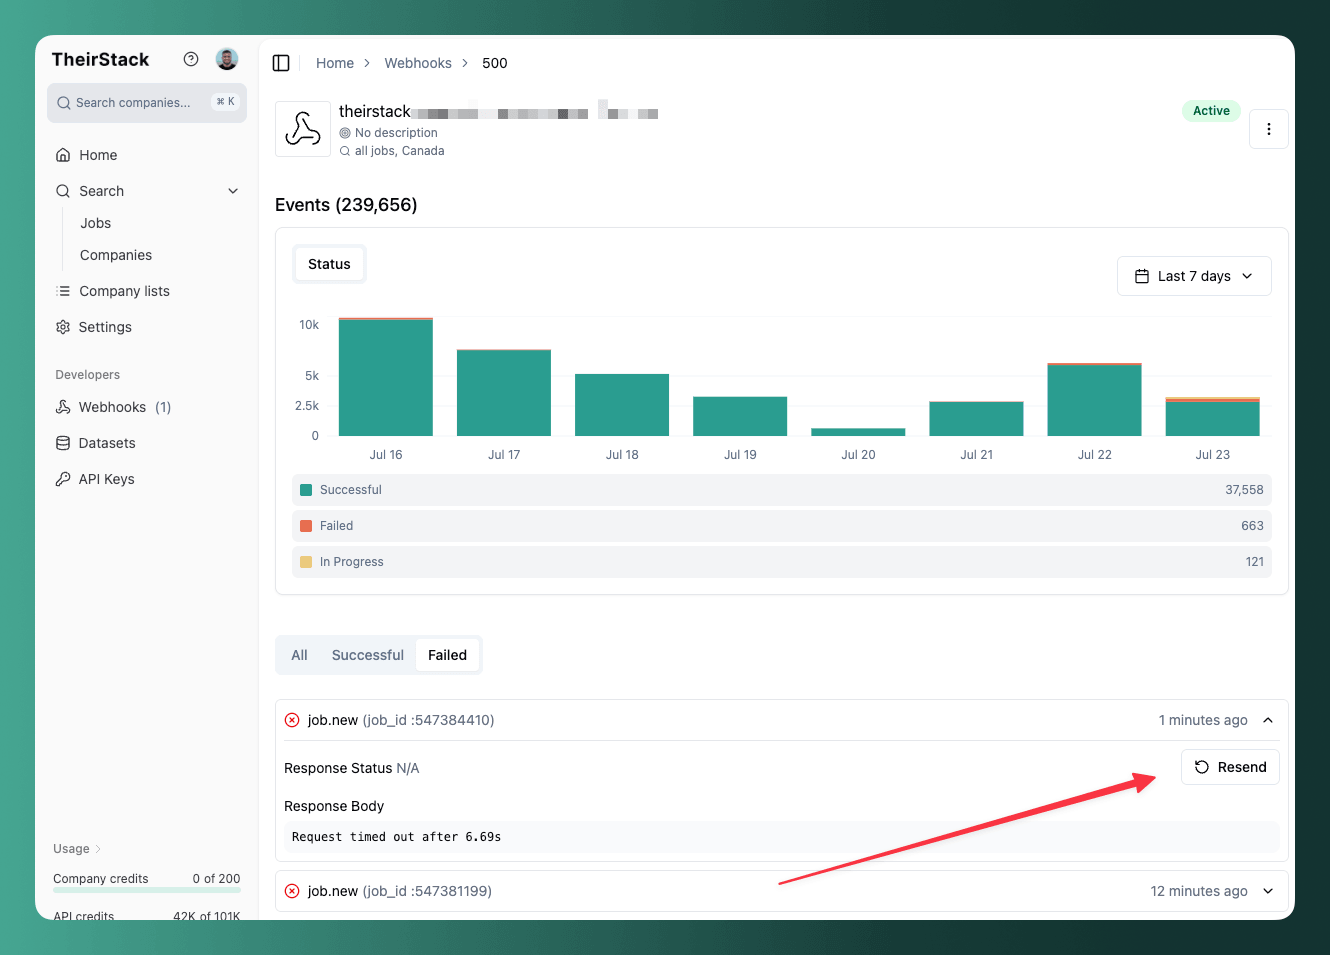
You can manually resend a failed webhook event by clicking on the "Resend" button in the webhook details page.
FAQs
How is this guide?
Last updated on
How to set up a webhook
Learn how to set up a webhook to get notified when events occur (new jobs, tech changes, etc) in TheirStack and trigger actions in your external systems like N8N, Zapier, Make, Airtable, etc
Limit how much a webhook can send
Set a daily event limit on a webhook so it never sends, or charges, more than you budgeted. Learn how the limit works, when records are dropped, and how to size it against what your search matches per day.