
Usage
See which delivery method, search pattern or webhook spends your credits, drill down to the individual requests behind any number, and share the investigation as a link.
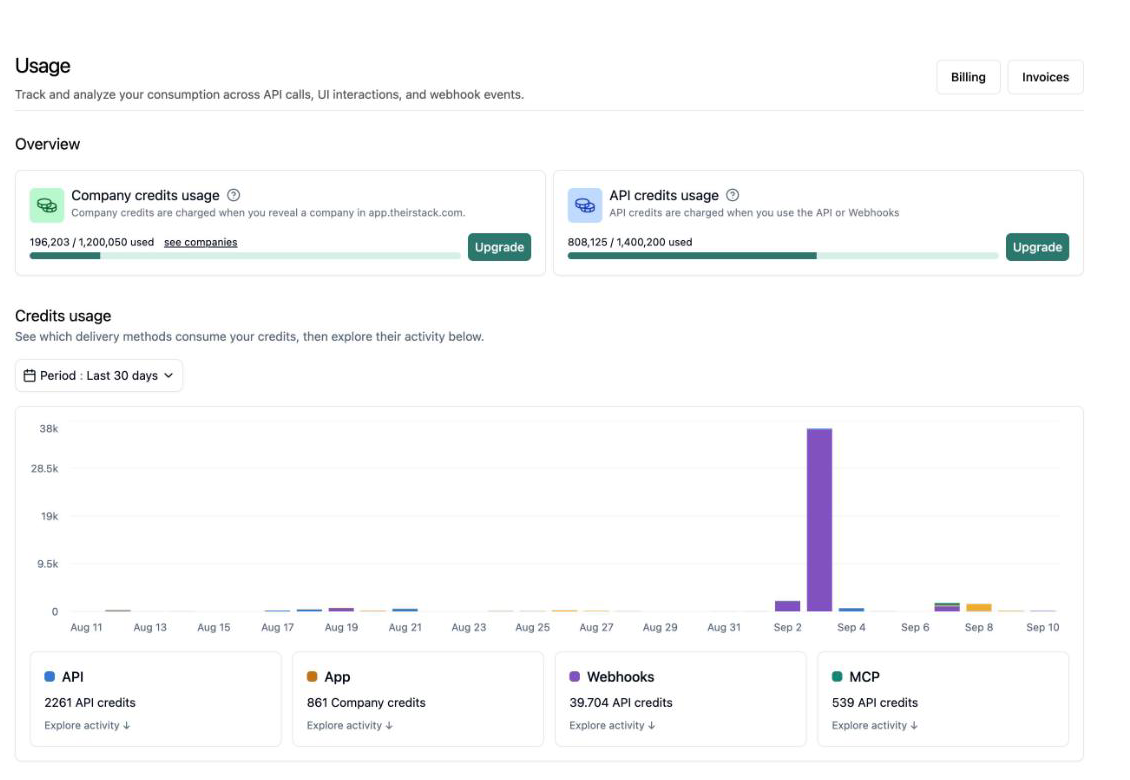
The usage page shows where your credits went. At the top you have your plan balance and a daily chart of credits by delivery method. The sections below it take any of those numbers down to the requests or webhook events that produced them.
Each section has its own Period filter. You can look at the last 7 days of requests while the credits chart stays on the last 30.
Credits usage
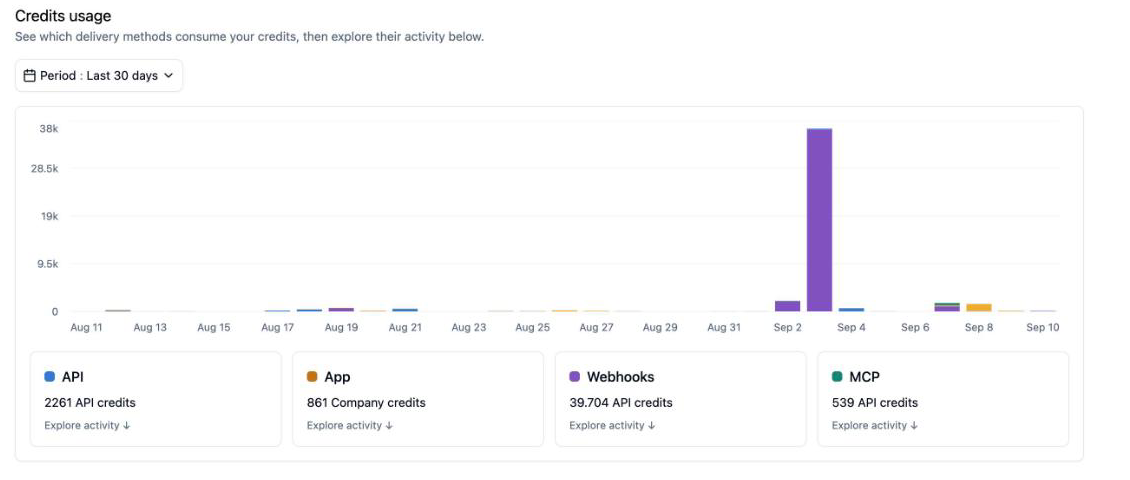
The chart stacks the credits consumed each day by delivery method: API, App, Webhooks and MCP. API credits and company credits are shown as separate units, since one doesn't convert into the other. Credits that can't be attributed to a delivery method are still counted, so the chart matches your bill.
Under the chart there is a card per delivery method with its total. Click a card to jump to the matching section with that origin already selected.
Webhook events
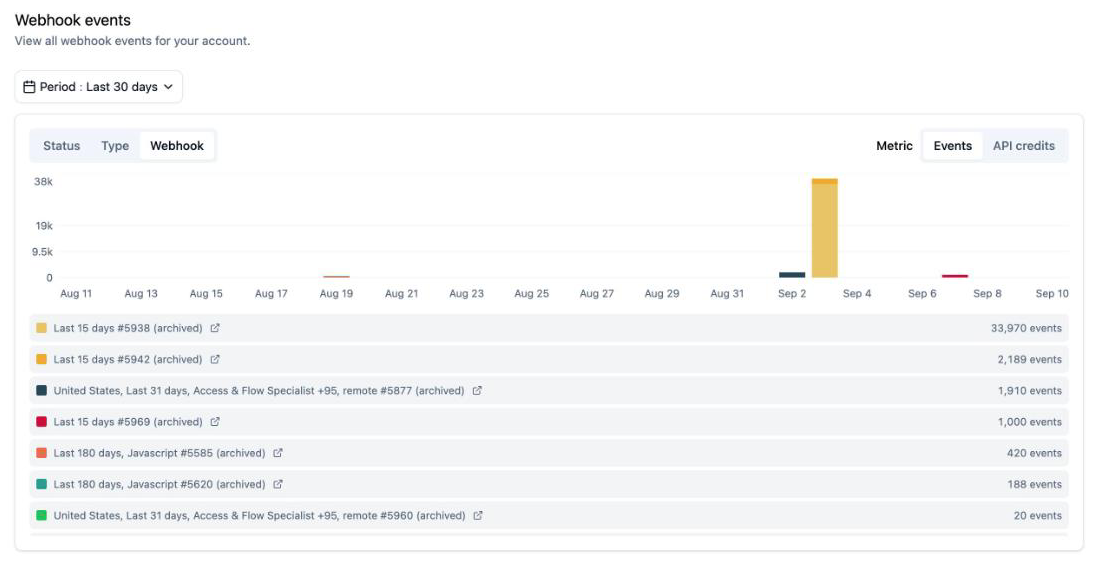
The webhook events chart shows the events triggered in the period. Switch the metric between Events and API credits to see how many events fired or how many credits they were actually charged. If a charge is split across several ledger entries, the event is still counted once.
You can break the chart down by:
- Status: success, in progress, failed or not triggered. Learn more about webhook event statuses.
- Type: the type of event.
- Webhook: the webhook that triggered the event, with a link to it.
Requests
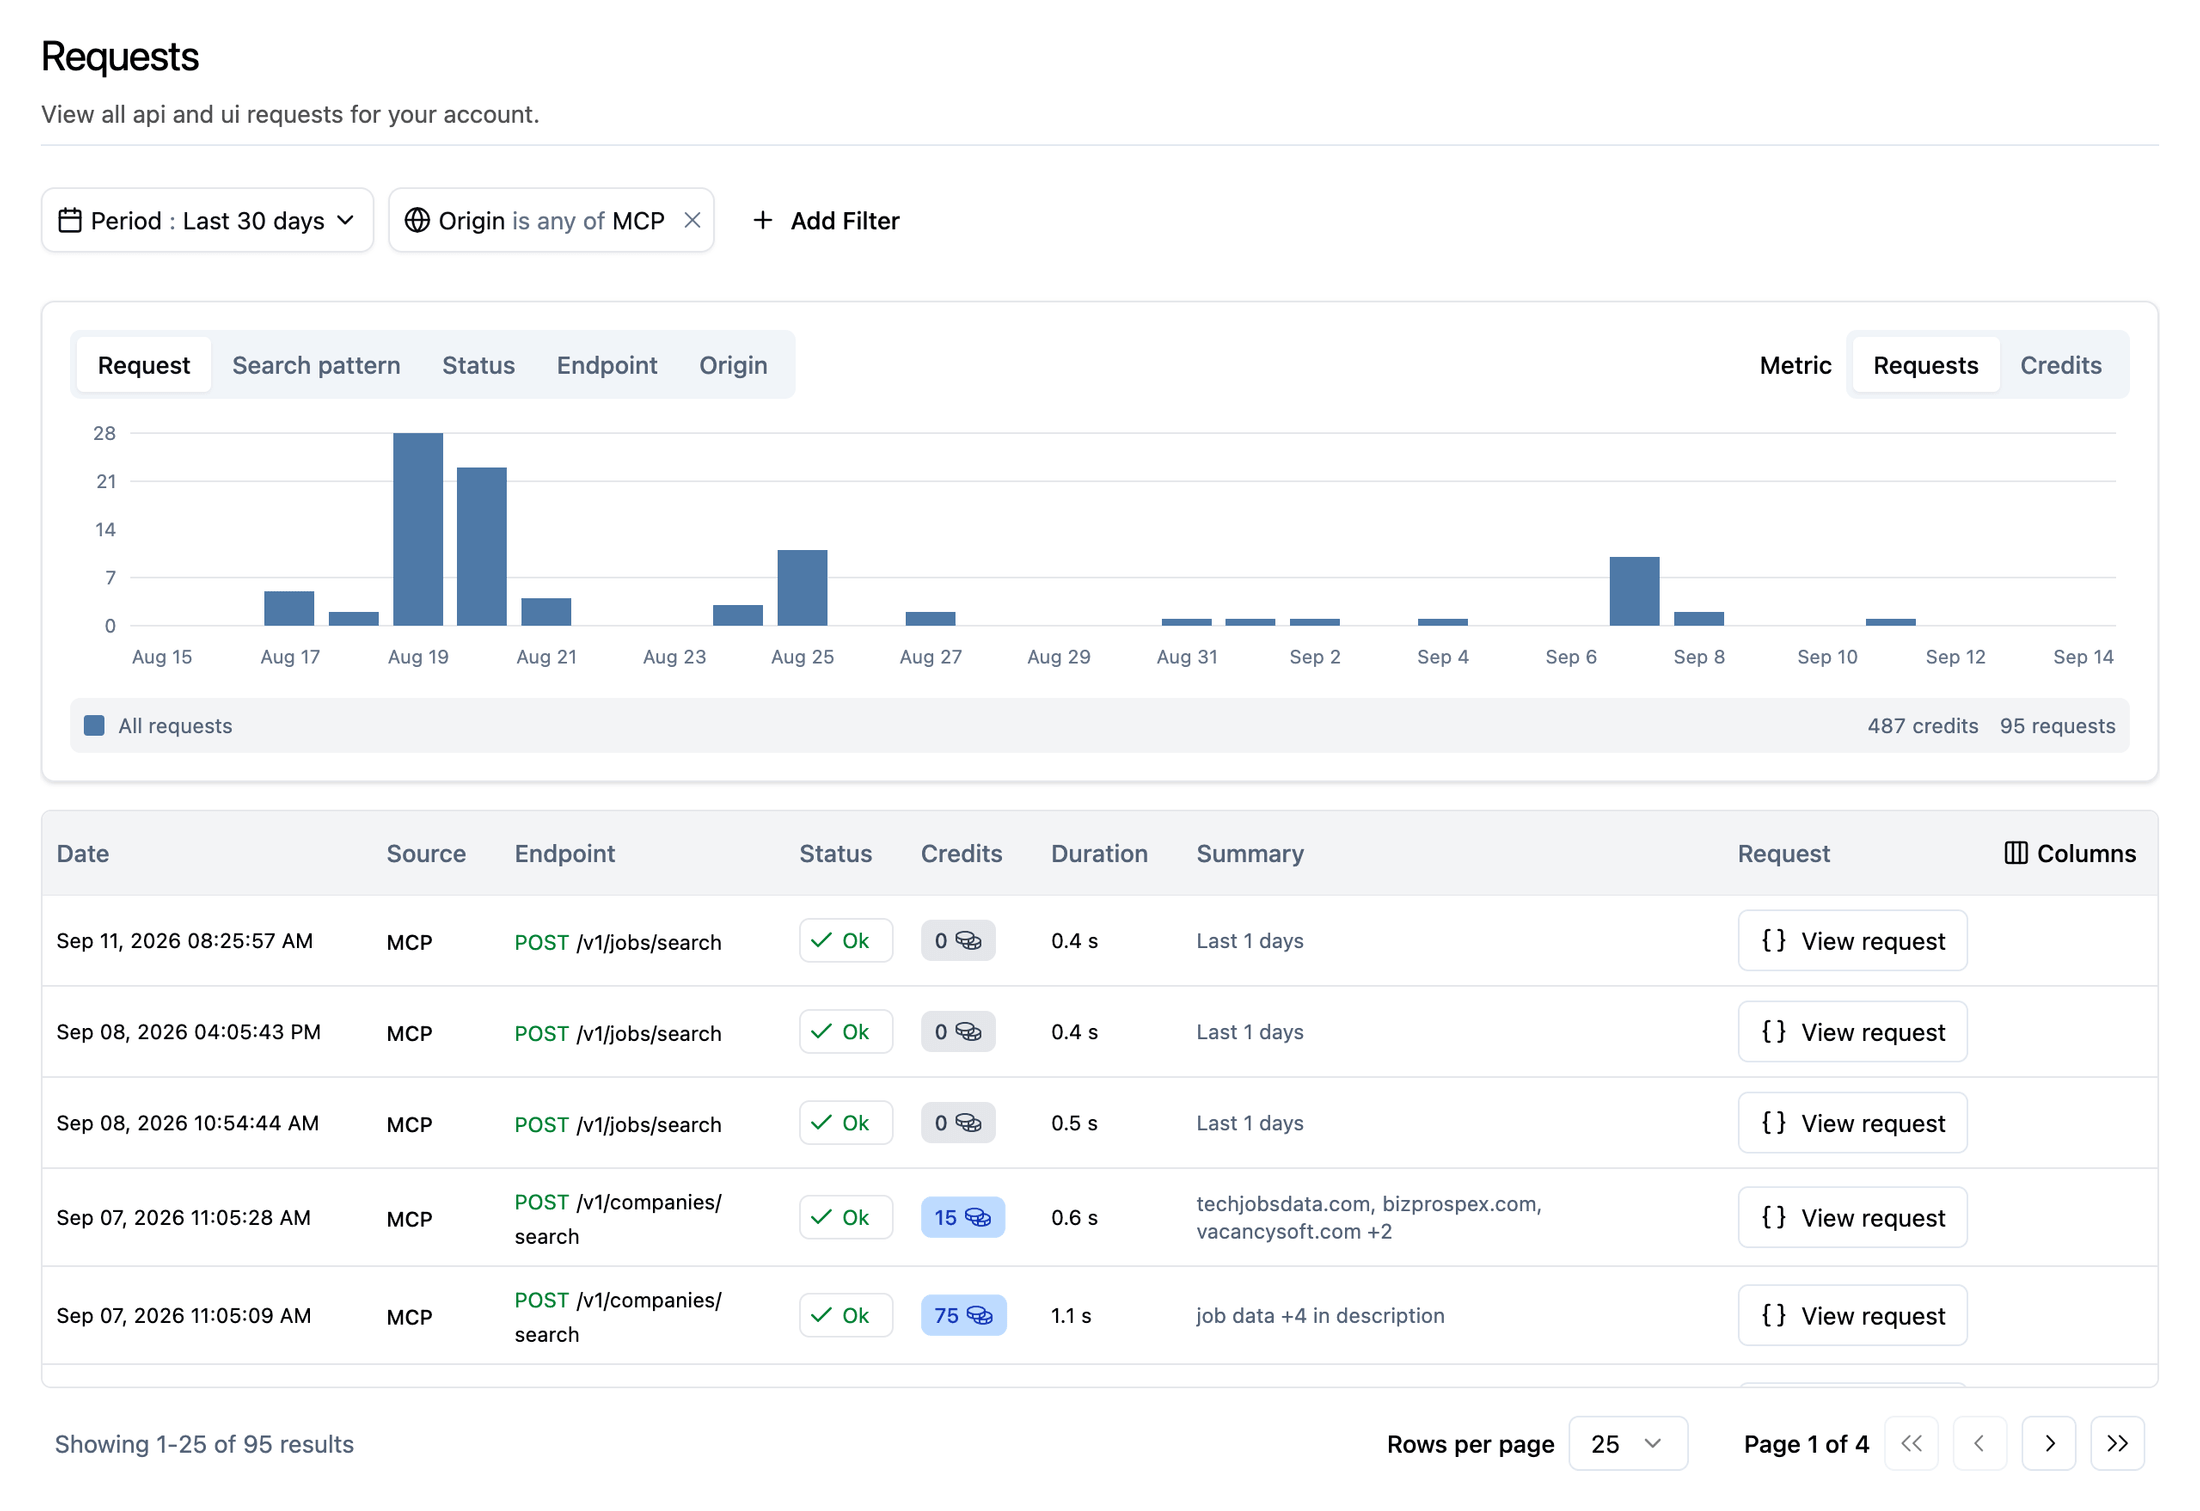
The requests section covers calls made from the API, the app and MCP. Switch the metric between Requests and Credits, and use the tabs above the chart to group them:
- Request: every request on its own.
- Search pattern: requests that sent the same filters. A saved search you run every morning shows up as one line with its total cost instead of thirty rows. Each pattern is tagged with its entity: job search, company search or technology search.
- Status, Endpoint and Origin (API, App or MCP).
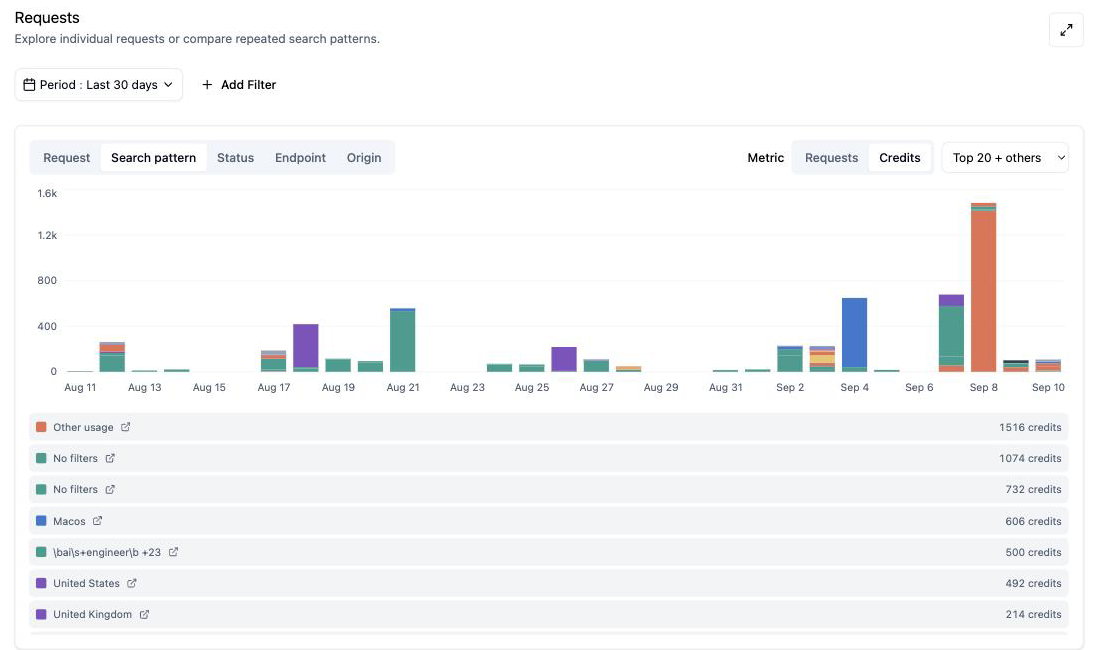
Hover or click a group to highlight it in the chart. The filter icon next to a group opens the request log with only that group's requests. Each request shows its date, origin, endpoint, status, credits and duration. Click View request to get the cURL command that reproduces it.
Add Filter only lists values that exist in your workspace, and shows the total for the selected metric next to each one. Open requests page opens the same view, with its filters, period and metric, on a page of its own.
Share what you're looking at
The period, filters, breakdown, metric, selected groups and page number are all stored in the URL. Bookmark it, or send it to a teammate, and the page opens in exactly the same state.
Why totals can differ between sections
The credits chart groups credits by the date they were charged. Requests and webhook events are grouped by the date the request ran or the event was created, and they include charges that were posted later. Because of that, the credits chart and the requests or webhooks sections can show different totals for the same period. When you reconcile them, compare the same set of requests.
Usage on the API key and MCP pages
The API key page and the MCP page show the same requests chart, limited to that channel. The MCP page also breaks usage down by tool, so you can see how many credits search_jobs and search_companies each used.
You can also read this history programmatically. GET /v0/requests/ lists individual requests. GET /v0/requests/analytics returns daily counts and credits grouped by search_pattern, endpoint, origin or status. GET /v0/teams/credits_consumption returns credits by charge date.
How is this guide?
Last updated on
Plans
Learn about the different plans available on TheirStack — compare features, credit allowances, and API access across Free, Starter, Growth, and Enterprise tiers to find the right fit.
Affiliate Program
Earn 30% commission for every new customer you refer successfully. Discover the commission structure, how payouts work, and how to get started.