See what spends your credits: API, app, webhooks and MCP

Co-Founder at TheirStack
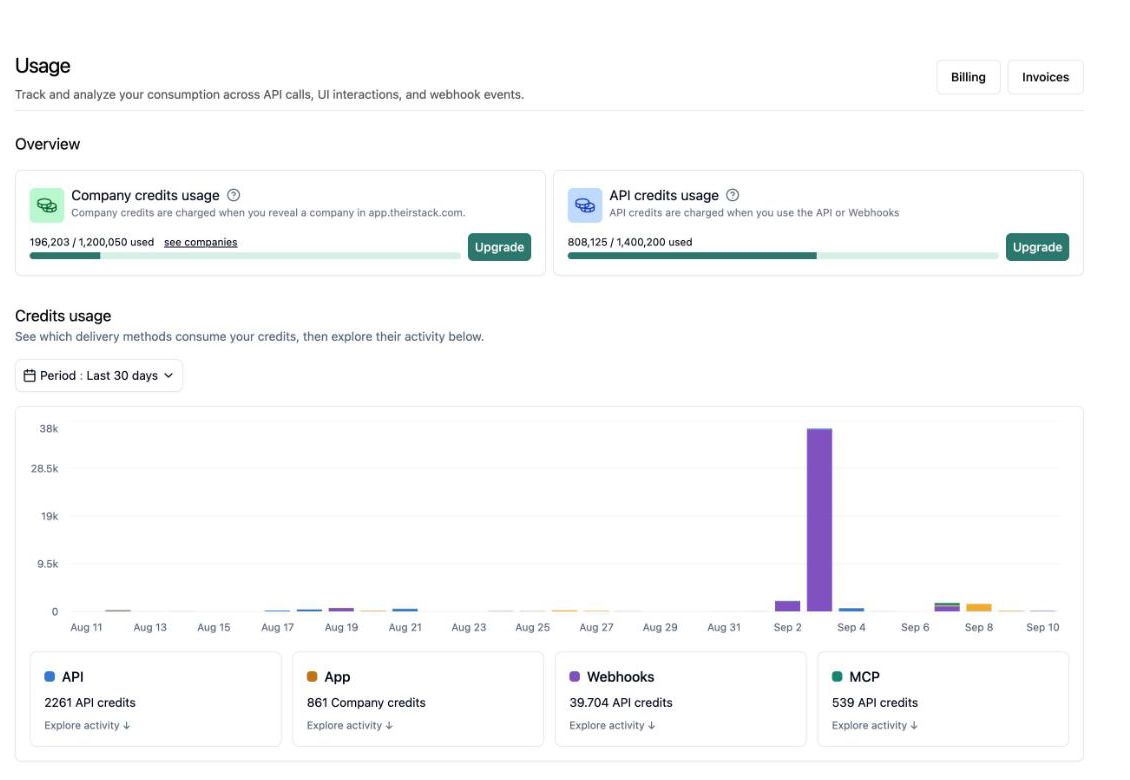
When your credit consumption goes up, the first question is where it came from. Settings → Usage now opens with one daily chart of credits by delivery method, and lets you follow any of them down to the calls that produced them without leaving the page.
Start from the overview
The overview stacks each day's credits by delivery method: API, app, webhooks and MCP. API and Company credits stay separate, because they are different units and adding them together would tell you nothing. Consumption we cannot attribute to a delivery method is still shown rather than dropped from the total, so the chart adds up to your bill.
Each card takes you to the section below with that origin already selected, so one click lands you on the requests or the webhook events behind the number.
Requests, grouped the way you search
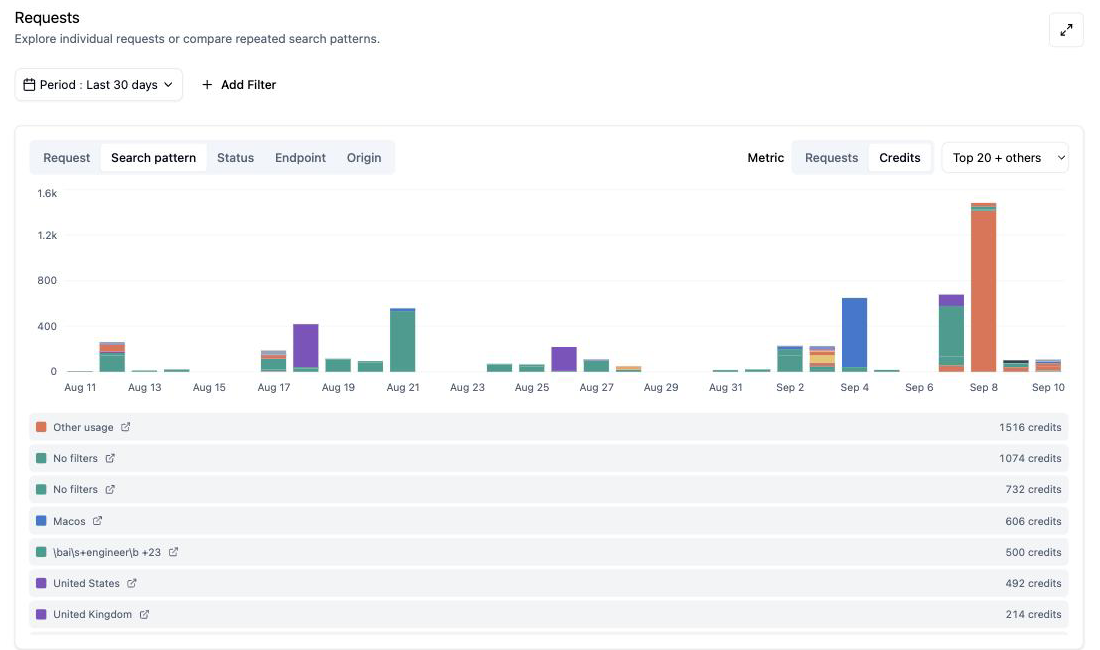
Requests are listed one by one, and you can switch the chart between request counts and credits. Breakdown by groups them by search pattern, status, endpoint or origin.
A search pattern is a set of requests that sent the same stable filters, so a saved search you run every morning reads as a single line with its total cost instead of thirty rows. Open a pattern to see the normalized filters behind it and drill into the original requests, each with its duration, credits, status and returned records, still on the same page.
Filters only offer values that actually occur in your workspace, and every option shows its total for the metric you are looking at, largest first. So you pick from what happened, rather than guessing at endpoint names.
Webhooks
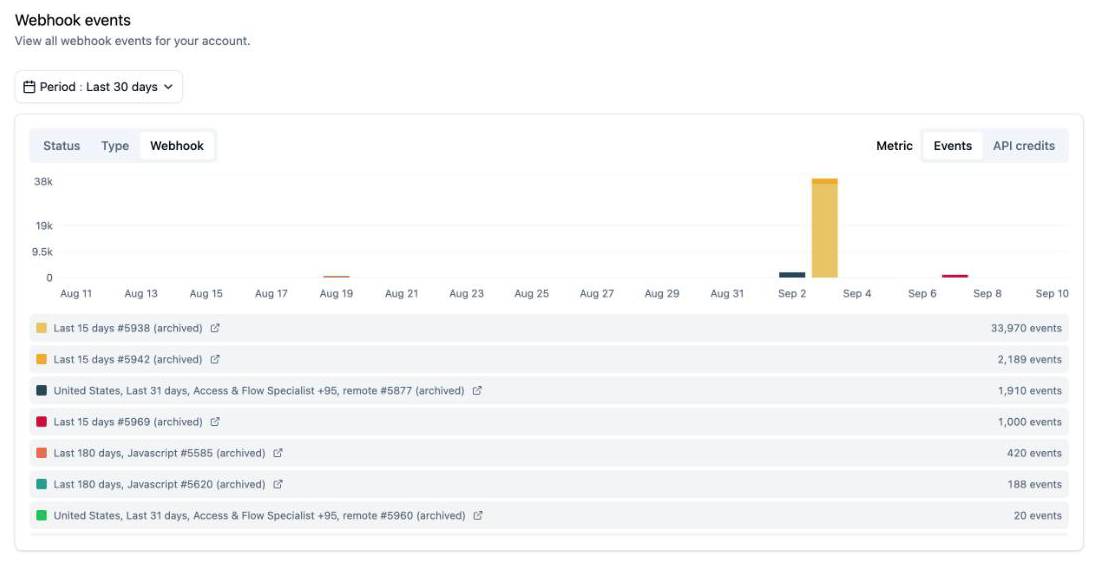
Webhooks get the same treatment: events or credits, broken down by webhook, event type or status, so you can see which one accounts for the period. A charge split across several ledger entries still counts as one event, so the counts and the credits agree.
Usage where you configure it
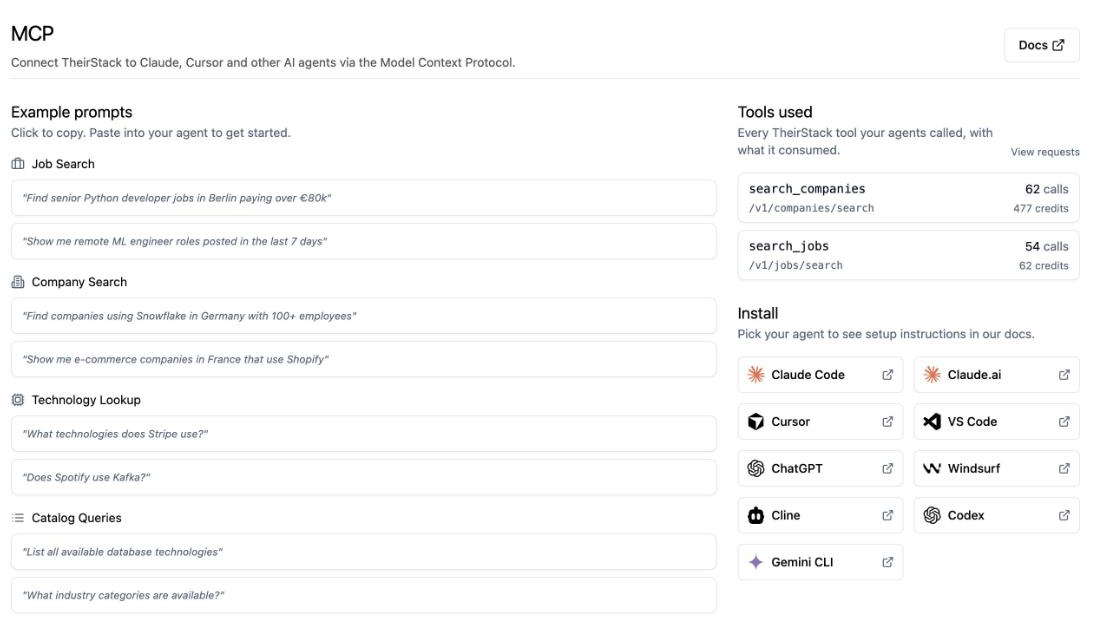
The API keys page and the MCP page now carry the same chart, scoped to that channel. The MCP page also breaks usage down per tool, so you can see what search_jobs and search_companies each cost you, and open the request log narrowed to one tool's calls.
Share an investigation
Dates, filters, breakdown, metric, selected series and page all live in the URL. Bookmark a spike or send the link to a teammate and they open exactly what you were looking at.
In the API
GET /v0/requests/ lists individual requests with their duration, api_credits and ui_credits. GET /v0/requests/analytics returns daily counts and credits, with group_by set to search_pattern, endpoint, origin or status. GET /v0/requests/facets lists the values you can filter on. For spending by charge date, use GET /v0/teams/credits_consumption.
The two follow different clocks, which is worth knowing before you reconcile them: the overview follows the date the credits were charged, while requests and webhooks follow when the request ran or the event was created, including charges that landed later. Totals for the same period can differ for that reason, so compare matching cohorts.
With MCP
Ask your assistant which searches used the most credits this week and how long their requests took. The usage tools get_requests, get_request_analytics and get_teams_credits_consumption read the same history, through the same authentication as the API, for the workspace you are connected to.